By: Nick Tran
“Good communication is the bridge between confusion and clarity” – NatTurner
As Transition and Activation Planners, we understand the value of clear and targeted communication. Communication aids in bridging the gap between project teams and stakeholders. The art of project communication involves developing a strategy to disseminate information effectively through the project life cycle. At Yellow Brick, we leverage dashboards to share information with project stakeholders. Dashboards offer a high-level glance at the project progress and status of deliverables using a combination of key performance indicators (KPIs) such as graphs, bar charts, line charts, and timelines. The data is then packaged in an engaging and eye-catching format to showcase critical project information.
Deciding which information to display on the dashboard can be challenging. Walking the tightrope between providing too much and too little information is a task that the most skilled project managers have mastered. The first step is understanding who the target audience is and what information is the most relevant and meaningful. Our team’s standard practice is to work with the project team and stakeholders during the planning phase to confirm the Executive Dashboard reporting strategy.
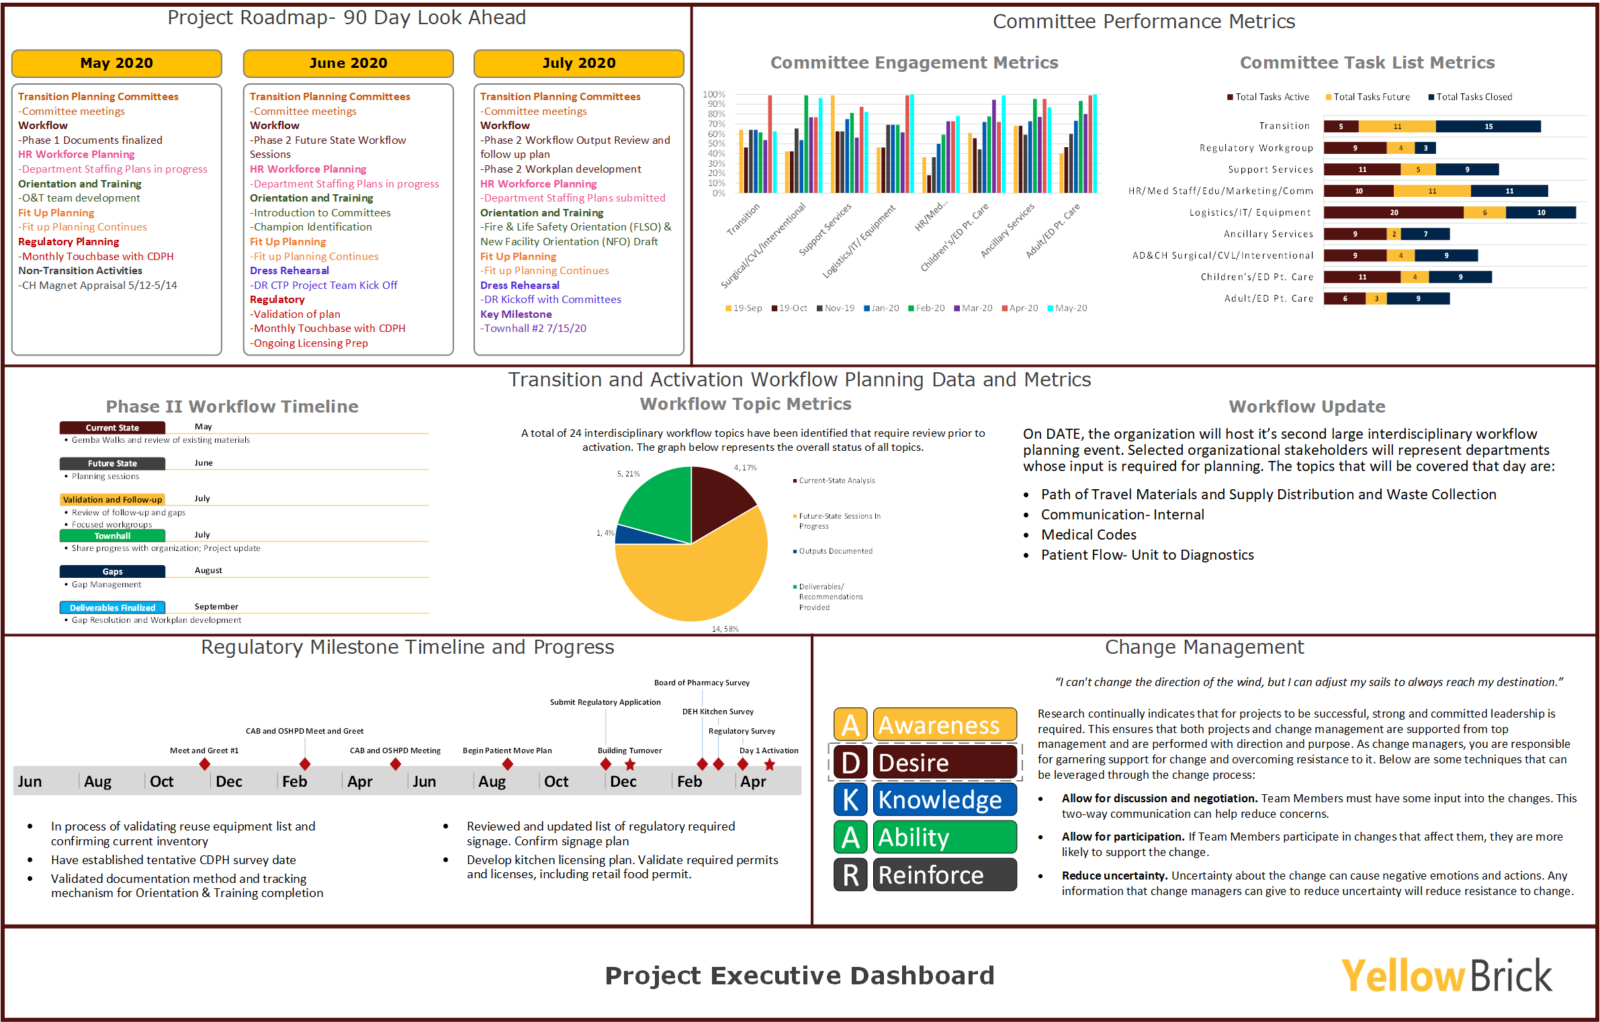
Sharing relevant metrics and data provides project teams and stakeholders the necessary information to move forward with their work. When information is flowing, work efficiency increases among the groups, more robust and transparent dialogue occurs during project meetings, and a collective buy-in is gained from impacted departments. All of this ultimately contributes to overall project success. Our team includes three standard data points on the Executive Dashboard: the Transition and Activation Timeline, a 90-Day Look Ahead, and Task List metrics.
The most straightforward component of the Executive Dashboard is the Transition and Activation Timeline. This piece is often the most challenging to produce, as confirming milestone dates and validating which information the organization feels confident in sharing can take time. The Transition and Activation Timeline displays high-level project activities and milestones. In our experience, we have rarely encountered a project where milestones and completion dates are established early with little adjustments required. Delays and shifts to milestone dates are common due to the complexities of building and activating a healthcare facility, so the Transition and Activation Timeline often goes through multiple iterations. Thus, the timeline is developed using a progressive elaboration or rolling-wave technique. The near-term milestones and activities are solidified first, while the far-term milestones, often referred to as “working dates” or “planning dates,” are confirmed once more information is known.
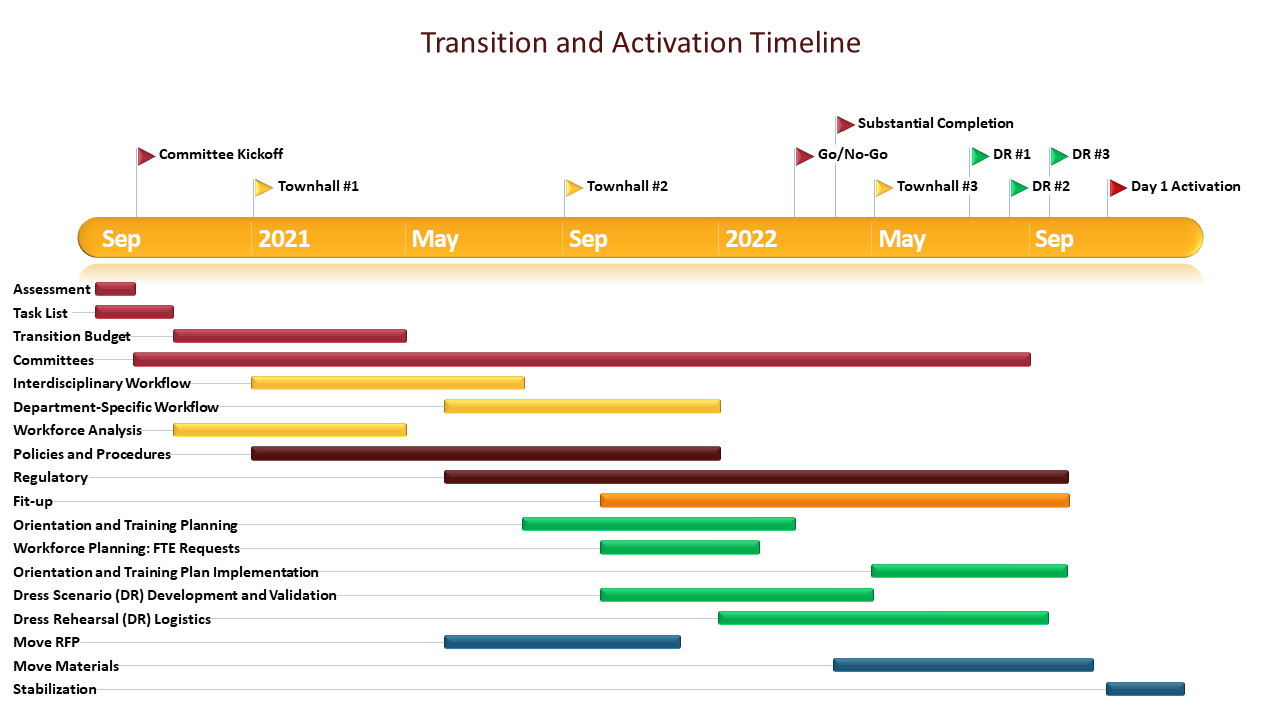
As the project progresses and milestone dates are solidified, the Transition and Activation Timeline is updated. Sharing this critical information enables stakeholders to make informed decisions and provides a level of autonomy should a deliverable fall behind, warranting the execution of prearranged mitigation plans.
Another component of the dashboard is the 90-Day Look Ahead infographic. This component is similar to a project plan as it provides a shared vision of what the project will accomplish in the near term. This shared understanding of upcoming activities focuses the team and concentrates their efforts to complete tasks that satisfy the project’s goals. The 90-Day Look Ahead data is pulled from the Project Roadmap. The Project Roadmap is developed early in the project and provides a more detailed breakdown of each month’s activities. The various scopes of work are then colorized to show the relationship to the final deliverables. This clarifies the project’s activities for that particular month and enables the team to plan for the upcoming activities.
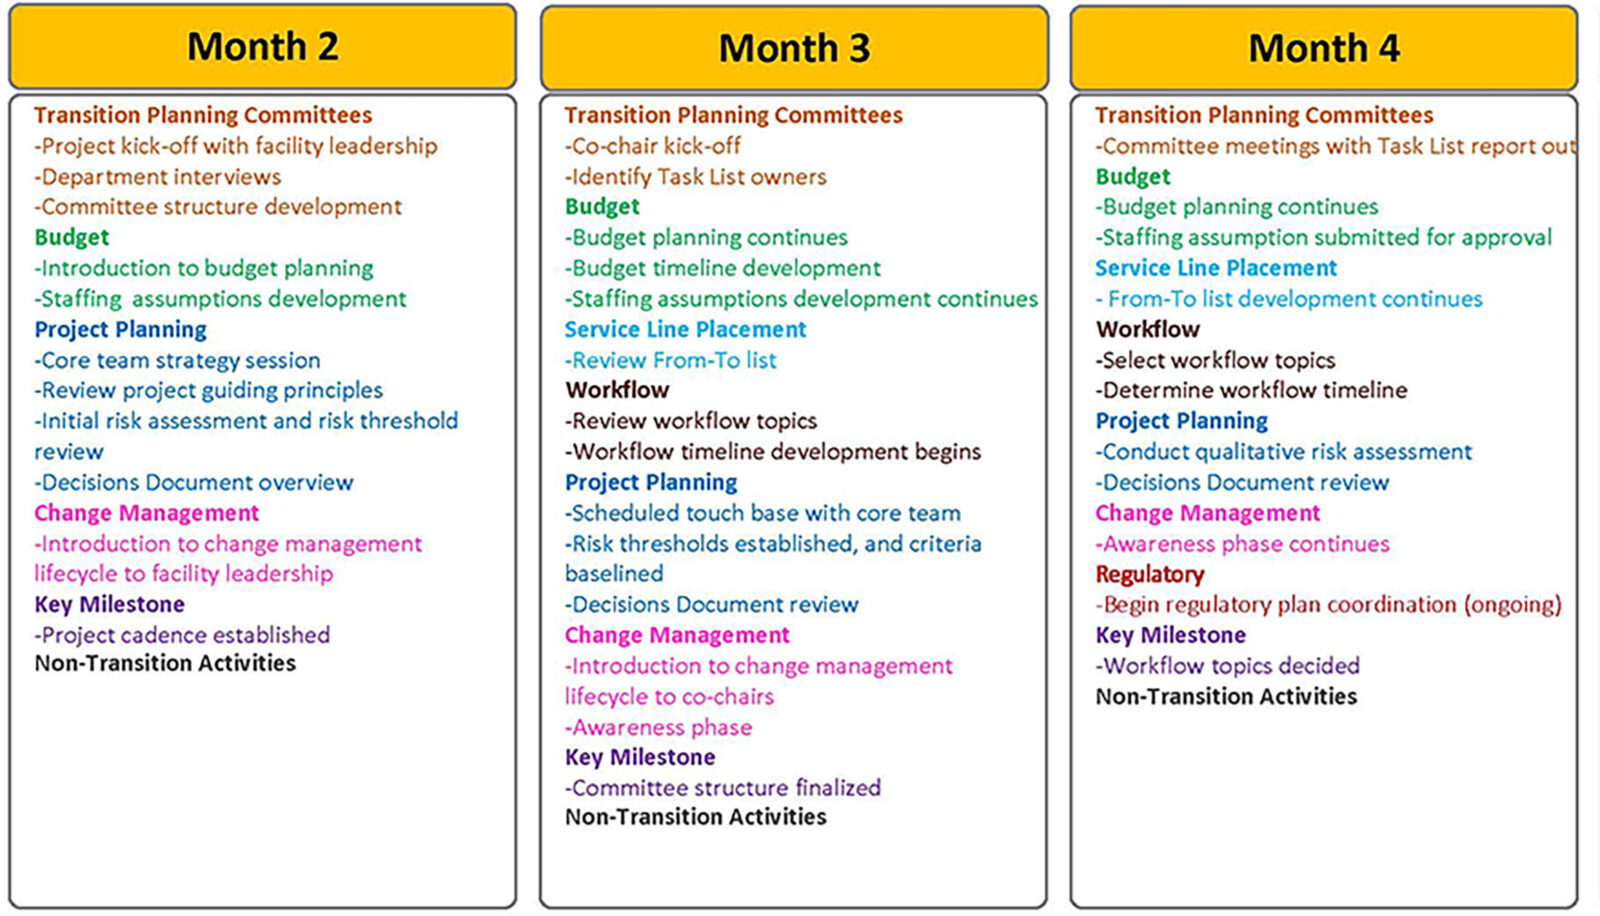
The 90-Day Look Ahead is essential to the Executive Dashboard as it is a powerful communication mechanism. Our Yellow Brick team updates and organizes the content on the Project Roadmap monthly. We recommend sharing the information with stakeholders and front-line staff to inform all impacted parties.
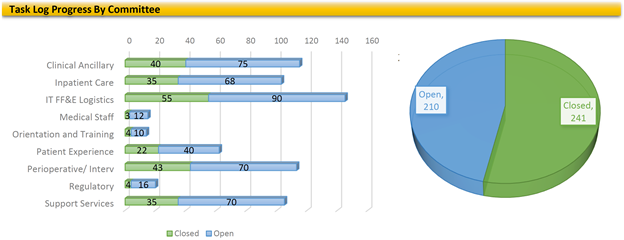
A complicated and intricate project like a hospital activation cannot be successful without a comprehensive Task List (action items list). Project members often feel overwhelmed with the amount of work that they need to complete. The Task List outlines the work breakdown structure required for the successful completion of the project. The list details the task, task coordinator, task team, start and end date, and status. The Yellow Brick team uses the Task List for the report out during committee meetings. Upon completion, tasks can be checked off the list.
This brings us to our final component of the Executive Dashboard, the Task List progress metrics. Throughout the project, our metrics track all the tasks assigned to the various committees. Metrics are then reported monthly to leadership. The real value of a project status metric lies beyond its uses as a communication channel. It also provides a documented history of the project progress from month to month. These metrics are a way to show if the project is on track and evaluate if any items require escalation. With many tasks and activities coinciding, the Task List metrics provide a high-level overview to leadership to confirm that committees are completing assigned work in accordance with the project timeline.
The Executive Dashboard’s elements are organized into a cohesive report to share with all project teams and stakeholders alike. The objective is to keep key stakeholders informed of project updates. The dashboard’s value is in communicating and tracking the details, deadlines, milestones, and activities that will lead your team and project to success.